Here’s how you can reach us:
07890 520 130
info@mattercommunications.co.uk

Charity Reports and Statistics

Posted on May 5th, 2023 by by JG Creative

Charity Reports and Statistics

This snapshot focuses on the health and status of charities themselves and contains highlights of CAF’s Charity Resilience Index, YouGov’s Charity Index Ranking and a collaboration between nfpResearch and CharityComms to deliver a new version of the Charity Communications Benchmark.

The Charities Aid Foundation (CAF) is a leading charity operating in the UK and internationally. The charity is acutely aware of the financial strain people are facing and the increasing demands this is placing on Charities while facing their own financial challenges and the resilience of the charity sector has never been more important. CAF produces and publishes The Charity Resilience Index which focuses on three key dimensions: charity income, demand for services, and operational costs. Their wider research into charity resilience, charity finance, and changes in giving habits provides further evidence of the challenges that charities are facing.

Key findings:

MOST CHARITIES HAVE SEEN AN INCREASE IN DEMAND FOR THEIR SERVICES
In January 2023, nearly 3 in 5 (57%) charities reported that demand had increased compared to the same time last year, including a quarter (24%) of charities who say that it has increased ‘a lot’. The research indicates that charities working for the prevention or relief of poverty are particularly likely to report an increase in demand for services.

ONLY ONE IN THREE CHARITIES ARE HIGHLY CONFIDENT IN THEIR FUNDING
A third (31%) of charities are very confident that their current funding is secure, whilst around half are confident that they have the funds to meet current demand. Less than 2 in 5 are confident that they can afford to maintain their staffing levels over the next year (36%) or have a plan for maintaining or growing their income over the next 12 months (37%).

MORE THAN HALF OF CHARITIES ARE WORRIED ABOUT THEIR SURVIVAL
Concern about survival peaked at 60% in December before dropping back in January (53%). The concern is particularly acute among charities involved in support or care services (e.g. those working with disabled people, children or the elderly). Across December and January, around 7 in 10 (71%) of these charities said that they were worried about struggling to survive, compared to 44% of faith-based charities.

CHARITIES IN THE NORTH OF ENGLAND ARE AMONG THE HARDEST HIT
In the North of England, demand has increased for nearly 7 in 10 (67%) charities, and two-fifths (40%) say it has increased substantially (compared to 55% and 24% across the rest of England). Charities in the North (63%) are also significantly more likely to have used their reserves to meet running costs than those based elsewhere in England (50%).

THE CAF CHARITY RESILIENCE INDEX STANDS AT 67%
The sector shows signs of vulnerability as it faces into the cost-of-living crisis, with an Index score of 67%. However, this has risen from 62% in December 2022 indicating that there is a slightly more positive outlook amongst charities in 2023.

Read the full report.

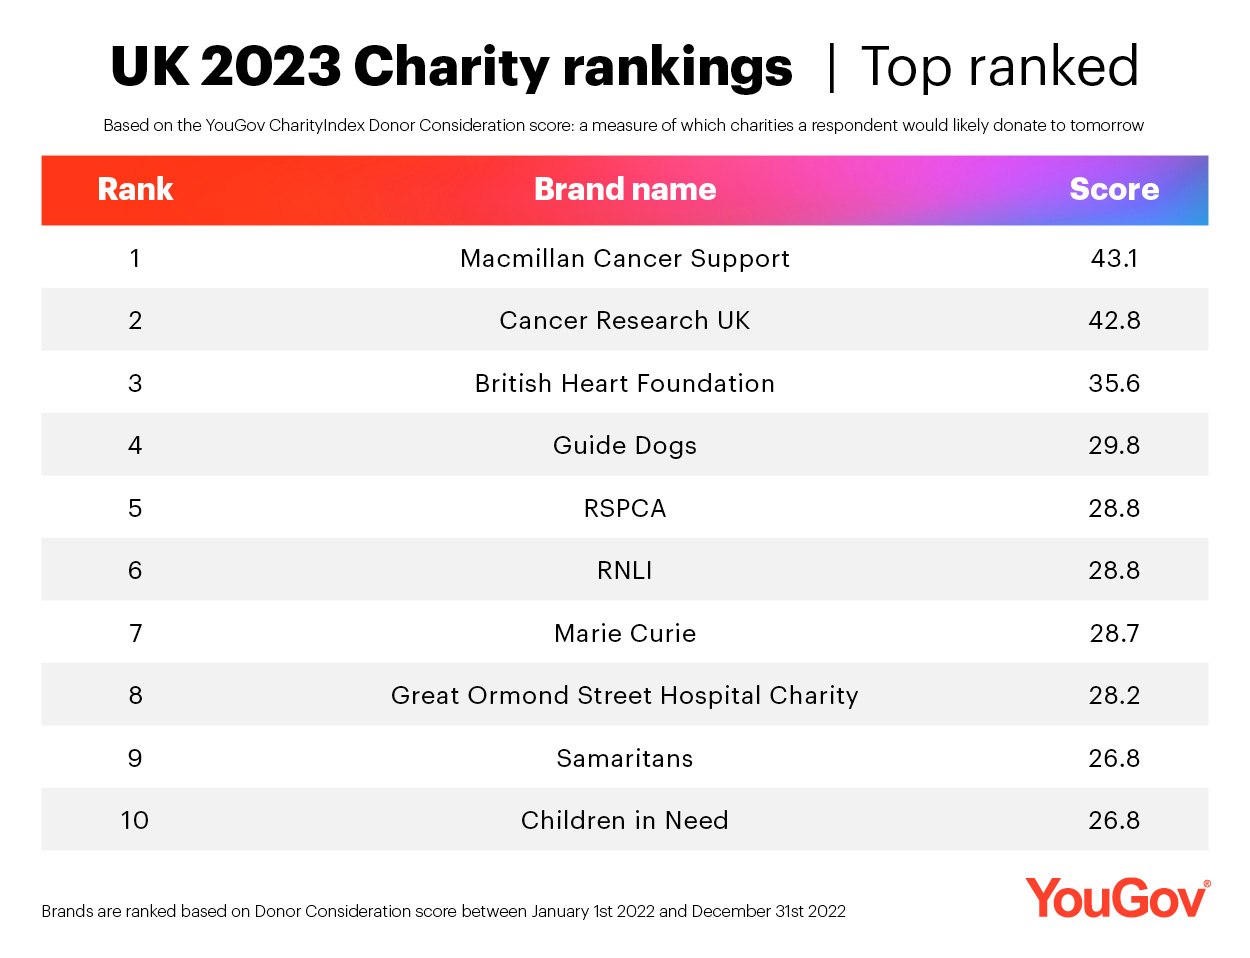
Every year YouGov’s Charity Index Rankings Highlights the best performing organisations in the third sector according to their overall brand health.

In 2023 Macmillan claimed first place with a score of 43.1 just above Cancer Research UK with a score of 42.8. The British Red Cross were the most improved with a score of 26.6 up from 23.7.

Find out more.

nfpResearch have collaborated with CharityComms to create a new version of the Communications Benchmark.

CharityComms was launched in 2007 with a mission to improve the standard of communications and champion its role in the sector.

One of their main aims is to provide evidence to help charity communicators benchmark how their organisations are doing, as well as gaining insights into how they feel about your comms and its place in their organisation.

The 2022 report compiles the views of more than 530 comms professionals from charities of all sizes, working at all levels of seniority, and includes insights to help the sector understand the impacts, challenges and opportunities comms professionals really face.

Key findings include:

The value of comms
An increasing numbers of people feel that comms have a good standing in their organisation, with 90% believing that communications are valued, and 72% thinking that comms are a strategic part of the overall operation of the organisation. Almost two-thirds think that comms and fundraising work towards an integrated approach, while 77% feel valued by their CEOs, and almost all CEOs (92%) spend time on comms every week. 

Balancing priorities
Comms teams’ top goals have not changed over the past five years and remain raising awareness of their charity‘s services (47%), cause (42%) and brand (39%), as well as engaging communities (37%) and acquiring donors (36%). The challenges in balancing often competing priorities have not changed either, with 38% thinking that a lack of joined-up thinking is one of the major challenges that impairs comms work, along with a lack of understanding comms by others in the organisation.

How data drives effective comms
87% perceive that communications in their organisations are ‘very’ or ‘somewhat’ effective and 81% think that their colleagues perceive their work as effective. While data-driven and impact-measured comms seem to be very relevant in staff’s perception of their own effectiveness, just 44% report that their comms are actually data-driven in practice, with 48% saying they measure the impact of comms effectively.

Looking to the future
Unsurprisingly, the cost-of-living crisis is the most dominant concern for comms professionals, both on a personal level around job security, as well as affecting fundraising and comms targets and creating additional pressure on workloads. Despite the pressures, many also expressed the positive nature of being part of a team or people making a difference and the change their work can make in society. 
Read the full report.

A Nationally Representative Sample

Posted on April 7th, 2023 by by JG Creative

A Nationally Representative Sample

The MRS undertakes a commercial benefits study using a truly representative national sample. A couple of years ago we highlighted Voices4all’s campaign to make ethnicity, sexual orientation and disability (in addition to age, gender, region and social grade) quotas a minimum requirement for all NatRep research samples. The MRS have joined the crusade and in the latter part of 2022 undertook a commercial benefits study to explore and define what commercial benefits are being missed within the traditional approach to Nationally Representative UK adult sample.

The MRS state that the UK the industry standard for a Nationally Representative UK adult sample has historically been based on age, gender, location, and sometimes socioeconomic status – however this overlooks a host of minority groups, from ethnic minorities to the LGBTQIA+ community and those with disability, whom in total represent about 30% of the population.

The conclusion of the report were as follows:

  • Unconscious Bias is established when unfounded opinions become beliefs
  • There is no genuine barrier to any industry stakeholder including Minority Groups in our base level Nat Rep Methodology for Online UK Research
  • There is a clear and strong commercial opportunity to access and understand the currently untapped views of these groups which collectively make up a third of the UK Population
  • This more inclusive approach is available in todays market and carries no cost premium

For full details of the report please visit the MRS website.

How accessible is your research?

Posted on January 27th, 2023 by by JG Creative

How accessible is your research?

For any research undertaken to be inclusive, it is important that it is accessible to all regardless of age, physical disabilities or mental health conditions.

What do we mean by accessible?

  • Can your survey be read by those with visual impairment?
  • Does the approach you have chosen act as a barrier to those with physical disabilities?
  • How can you ensure those with hearing difficulties are not excluded?
  • Is online the right medium for those with sensory disabilities?
  • Are you using language that is appropriate and accessible to all?

Creating accessible surveys

To begin with you will need to ensure you keep font size to a minimum of 12pt and keep colour to a minimum or if colour is used ensure there is sufficient contrast. And do not forget to always use ‘plain English’.

For online surveys will need to look at layout and routing of survey  to make it easier for assistive technologies to navigate and it may also be worth looking at using verbal rather than visual scales to further assist navigation.

If possible, look at producing both a pain text as well as dynamic version of the survey. Some survey software has this facility built in i.e. SnapSurveys.
Snap Surveys Accessibility Statement.
 

You may also consider using both online and postal survey or giving respondents the opportunity to response by telephone.

We recently worked with the Business Disability Forum (BDF) on the design and development of a membership survey taking account of the principle outlined above. The Business Disability Forum is the leading business membership organisation in disability inclusion and was keen to ensure that the survey was as accessible as possible.

What about qualitative research (focus groups and one-to-one depths) is online the answer?

The pandemic accelerated to the move to online qualitative which has benefited accessibility in a myriad of ways. However it is not the panacea for all accessibility issues, and we still need to consider the most appropriate methodology given our audience and the task at hand.

While online interviews do have a number of benefits including:
• No need to travel to a venue.
• Participants are in their own space/homes.
• Direct access to their own technology.
• Close captioning may be available.
• For those with hearing difficulties, online interviews can involve close captioning.
• Less costs for the participants.

They also have some potential drawbacks:
• Other participants online interviewing can lead to auditory, visual, and kinaesthetic difficulties.
• Excludes those without access to relevant technology i.e. internet, Laptop, computer, tablet or mobile phone.
• Not everyone has their own space.
• Screen fatigue.

 So how to make in-person research more accessible?

  • Use locations that are easy to access by public transport and with adequate disable parking.
  • Make sure the building is accessible (disabled access is not always that accessible)
  • Ask if support dogs are welcome.
  • Make sure there is easy access to facilities within the building i.e. toilets.
  • Is there space for wheelchairs?
  • Can you make the relevant technology available?
  • Is there a hearing loop in place?
  • Think about using BSL translators if necessary.
  • Carers may need to accompany respondents.
  • Think about dietary requirements.
  • And do not forget to make sure that any stimulus or collateral used is also accessible to all!

At the end of the day we all need to be building accessibility into the design of any project we undertake be qualitative or quantitative, virtual or in-person.

Business Disability Forum

Posted on January 20th, 2023 by by JG Creative

Business Disability Forum

Business Disability Forum (BDF) is a not-for-profit membership organisation which has over 500 members, mostly businesses, but also some charities and statutory sector organisations.

BDF haven’t run a membership survey in 4 years but were developing their next 5-year plan and wanted robust membership input. The results of the survey would also help them to improve their marketing to recruit new members.

The Questionnaire had been written and Matter were asked to:

  • Input to improve the questionnaire, increase response rates, get the data needed most effectively – flow, length, suggested edits to questions or question formats used, user experience
  • Script, test and host the survey
  • Provide data analysis (including data tables) and a summary report including open ended question analysis

BDF was also keen to ensure that the survey was as accessible as possible. To this end we produce both a ‘standard’ and plain text version of the survey, both accessed via the same email invite, with the ability to navigate between both versions.

The plain text version complied with the WCAG 2.1 guidelines. Checkboxes were arranged in a single column and code labels are placed to the right of the checkbox which helps screen readers correctly associate labels with code boxes. Grid questions were also expanded to single columns to make it easier for assistive technologies to navigate and routing was simplified to further aid navigation.

In addition colour was removed to again make the survey easier to read, fonts size was kept to a minimum of 12pt, and verbal rather than visual rating scales were used.

BDF also offered the option to complete the survey verbally and made hard copy and hard copy large print versions available on request.

In total over 20% of members responded to the survey. Excel data tables and a PowerPoint summary were created and presented back to the BDF leadership team.

The National Council of Women

Posted on November 4th, 2022 by by JG Creative

National Council of Women

The National Council of Women (NCW) of Great Britain was founded in 1895 as a response to the unsatisfactory working conditions faced by many women at the time. Known as the National Union of Women Workers, the organisation quickly developed into a nationwide network of small groups, and within two years had become affiliated to the International Council of Women (ICW). It has since worked in the UK and internationally on issues of concern to women.

NCW recently revisited their vision, purpose, and values. As a result of this the decision was taken to refresh both its brand and website, in line with this new articulation of the vision, purpose and values, in order to:

  • Recruit new members
  • Create a modern, professional, and easily recognisable brand
  • Deliver consistent key messages and tone of voice to speak to the key audiences

As a precursor to this refresh, research was undertaken to gain a clear understanding of current perceptions of the brand with existing members and target audience. Exploring and defining how they feel about the organisation and its strengths and weaknesses. An online survey and offline surveys were mailed to existing members, while the existing website and social media channels were used to distribute an online survey to the potential target audience.

The surveys were also used to invite both existing and potential members to take part in a series on mini online focus groups. This allowed us to investigate current motivations to join NCW in more depth, to explore the most appropriate tone of voice and the authenticity and credibility of potential language in more detail and to identify any potential gaps between current perception and desired vision and value.

Key research findings and recommendations were fed into the brand brief, website restructure and development of an appropriate tone of voice.

The new branding maintains their key brand colour and introduces a set of four bold, feminine and arresting secondary colours. The logo retains their recognisable round shape, but rather than using the flowers from the three countries of the UK our design focuses on the coming together of people to represent the strength of the NCWGB. This is accompanied by a new strapline ‘For a fair and inclusive society’, taken from their vision.

Modern Milkman

Posted on August 5th, 2022 by by JG Creative

Modern Milkman

We were invited by The Modern Milkman to pitch for an insight and brand development project they were undertaking. The ethos behind the company, founded in 2018, was to encourage the reduction of single use plastic by delivering milk direct to the doorstep in reusable and plastic free packaging.

Modern Milkman were in the process of rebranding and had developed a new brand positioning and a number of possible brand identities and associated messaging. They needed to understand which of these routes their customers would most engage with and ultimately enable them to achieve their 5-year business strategy. They also wished to use the opportunity to gain a deeper insight into who their key customers were, how they and potential customers felt about the brand and what were the key drivers and barriers to a doorstep delivery service.

We recommended a two-stage process, firstly a qualitative phase to explore reactions to the band and creative concepts followed a quantitative stage to deliver robust data on which key business decisions could be based. The qualitative exploration was undertaken via online, one to one depth interviews with both customers and potential customers. The insight from this stage was used to both refine the creative concepts and develop the content of the quantitative surveys. Two online surveys were then undertaken, one with existing customers and one with potential customers, via an online panel. We also boosted the panel survey with those who currently take doorstep deliveries from competitors. Mosaic codes were then appended to both surveys in order for geo-demographic analysis of the findings to be undertaken. In total we engaged with over 4000 individuals across the project with the customer survey delivering a double-digit response rate.

The key market insights gained from the research were delivered back to core personnel within the company via a number of tailored repots and online presentations to underpin the brand strategy and inform the acquisition strategy.  The communications feedback was shared directly with the creative team during a series of working sessions and a new brand identity and messaging hierarchy was launched.

We have continued to work with Modern Milkman on a number of projects including both brand tracking and new product development.

A Nationally Representative Sample

Posted on June 9th, 2021 by by JG Creative

A Nationally Representative Sample

Voices4all aim is to make ethnicity, sexual orientation and disability (in addition to age, gender, region and social grade) quotas a minimum requirement for all NatRep research samples.

They have researched and gathered the latest government data to inform the best possible approach to deliver the most representative national sample for UK research. The key area of focus is achieving representation of minority groups (alongside the traditional quotas of age, gender, region and social grade). Our sources and the related minority groups areas are:

  • Ethnicity taken from the 2011 Census.
  • Sexual Orientation taken from the 2017 Office of National Statistics NPS Data
  • Disability taken from 2011 Census, as well as elements of the forthcoming 2021 Census.

Voices4all have stated that these sources are the most current and trusted sources that we can benchmark our approach to at this point in time. They will review their setup each year as new government data becomes available to ensure that it is as up to date as possible.

They have aimed to provide robust base sizes so that minimal weighting is required, and that the final data set delivers the best-case share of voice whilst minimising the margin of error.

Download their guides to help you with demographic questions here, and quota set up, sampling and weighting here. 

Charity Reports and Statistics

Posted on May 6th, 2021 by by JG Creative

Charity Reports and Statistics

During our time working within the charity sector, we have come across a number of reports into the sector and wanted to share the key findings of some of them.

Charities Aid Foundation produces an annual report on UK Giving. The report ‘provides unique research and insights into how people in the UK give to charity, how much they donate and the causes they choose to support’. Key findings from the 2020 report include:

1. Donation levels in-line with previous years
Despite less in-person fundraising, donation levels have held up during the pandemic. Sponsorship levels have fallen and remain low. In August, only 4% of people sponsored someone for charity, just half of normal levels seen for the time of year.

2. Giving money
Between January and June 2020, the public donated a total of £5.4 billion to charity – an increase of £800 million compared to the same period in 2019.

3. What people give to
There was a large increase in the number of people donating or sponsoring to the cause ‘hospitals and hospices’ during the height of the pandemic’s first wave, whilst up to a fifth of people specifically reported donating to charities which support the NHS.

4. Less physical fundraising
There was a significant decline in the amount of money donated to ‘medical research’ between January and June 2020. This cause, which often attracts donations via fundraising events, such as the London Marathon and coffee mornings, lost out on up to £174 million during the first half of the year.

5. Cashless giving increases
As opportunities to fundraise through face to face interactions have declined, there has been a large and sustained increase in cashless giving since March.

6. Trust in charities grows
Trust in charities, which increased during 2019, has increased further since March 2020. The improvement is seen across different age groups and social grades.

Read  the report

Every year, YouGov’s UK Charity Index Rankings highlight the best-performing organisations in the third sector according to their overall brand health. In 2020, Macmillan Cancer Support have claimed first place with a score of 48.2, while Oxfam have topped our Improver list with a score of 14.7 (+5.1). 

Charity Index Top ten Rankings

Nfp Synergy produce a number of extremely insightful reports every year but perhaps currently the most prescient of these
is ‘a series of polls to understand the public response to the pandemic and how it is impacting on charities’. Key findings from the 6th wave conducted in March include:

  • Charity visibility remains very low with 55% unable to name a charity responding to the pandemic one year in
  • Giving levels have dropped again to their lowest point
  • Concern about the pandemic has dropped substantially to its lowest levels yet, while concern about mental health has reached a high point
  • Concern about the impact of the pandemic on a number of vulnerable groups continues to decline
  • Lockdown fatigue is setting in, with decreasing numbers planning on staying in their local area
  • Nevertheless, government satisfaction is up as the vaccination programme continues apace
  • There are low levels of comfort with interacting with charities except for visiting charity shops.

Read the full report

Top 10 tips for setting up your own survey

Posted on May 5th, 2021 by by JG Creative

Top 10 tips for setting up your own survey

  • Before you start, be clear about what you really need to know and focus on this before you start writing out a list of questions
  • Always use plain English but also make sure it is appropriate for each of your audiences, you may need to word things slightly differently for different audiences.
  • Make sure you have a logical flow in your questions, don’t bias the answer to one question by the ones you have asked just asked, don’t using leading language and don’t make it obvious what you would like people to say.
  • Think about the format of the question i.e. it is better to rank or rate each option rather than just asking for a single preference. If you have clarity on what the likely options are, have a list but if you are less certain, give people the opportunity for free text responses.
  • Don’t asked double barrel questions i.e. how happy were you with the speed and quality of response? I might have been impressed with one but exasperated by the other.
  • Think about how you may want to analyse the data as this may impact how you ask the question.
  • Use visual scales (e.g., smiley faces) if they add value but make sure they are relevant and appropriate for your audience.
  • Don’t forget to capture relevant demographics. e.g. age, gender, relationship with you, length of relationship, location etc.
  • Make sure to test it thoroughly with those who weren’t involved in its development.
  • Finally choose the right distribution channel – online may be the most obvious and cost-effective choice but is it the right medium accessing for your audience i.e. internet penetration drops off significantly by age.

Any more questions on developing or setting up surveys please get in touch.

Citizens Advice – Case Study

Posted on May 3rd, 2021 by by JG Creative

Citizens Advice – Case Study

Citizens Advice invited us to pitch for a brand strategy development project they were undertaking. The charity which provides confidential advice online, over the phone and in person for free helped over 2 million people one-to-one during the first year of the coronavirus pandemic and saw 62.8 million page views of their advice content during the same time.

Citizens Advice underwent a full visual rebrand in 2015, and in late 2018 undertook work to refresh their organisational narrative. They were now looking to develop a brand communication strategy to align with the organisation’s wider strategic ambitions. Before doing so they needed to gain a clear understanding of current perceptions of the brand, its strengths and weaknesses and how this has changed over time.

The first stage of the project was a large scale consultation exercise which we undertook to assess current brand awareness and perceptions. We benchmarked these findings against existing research to gauge the potential shift, identify direction of travel and map out the journey still to be taken. The research was undertaken with a representative sample of the UK population, current clients, volunteers, local and national staff, major funders including Government departments and corporate partners. We also undertook additional research with BAME respondents and those living with disabilities to ensure a truly representative view and inform aspects of the charity’s work around improving equity, diversity and inclusion. Given the lockdown restrictions and MRS guidelines all research was conducted via the telephone or online surveys. In total over 3,000 individuals were engaged.

We took the insights gained from the research and disseminated them throughout the organisation, including the Executive Leadership Team, via a series of tailored reports and presentations. The key communication insights were then fed directly into a series of online interactive workshops, alongside a SWOT and PEST analyses, to facilitate the development of the brand and marketing strategy.

We are now finalising a set of key messages which will be used across the organisation to educate key audiences and change perceptions of who Citizens Advice are and what they do.